Konfabulator has a mode of operation that's known as Debug Mode. This mode lets you type JavaScript to be evaluated while your Widget is running, and thus it can be an invaluable tool for debugging your Widget. Also, when people find problems using your Widget, it can be helpful to have them go into Debug Mode and report some information to you.
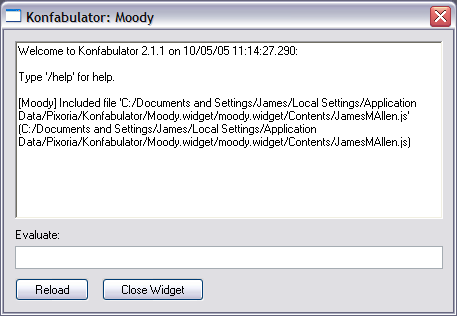
Here is a screenshot of the debug window in action:
You can enable Debug Mode in a variety of ways. The simplest way involves a few clicks and keypresses. You can also modify your code to always launch in a particular mode.
Clicky-clicky method[]
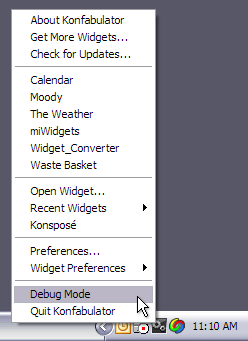
While Konfabulator is running, find the system tray/menu bar icon. In Mac OS, this is on the top right of the screen, and in Windows, it's usually on the bottom right.
For both Mac and Windows:
- Hold down the Control and Shift keys.
- Click on the Konfabulator icon.
- Click on "Debug Mode" to enable/disable it.
Now, any Widgets that you start up will start in Debug Mode. Make sure to disable it when you're done by following the same steps above, or else you'll probably be annoyed by all the debug windows popping up!
Code method[]
You can also enable/disable Debug Mode on a per-Widget basis by specifying it in your widget's .KON file.
- Open up the .KON file of your Widget.
- Find the <widget> line.
- Add the debug attribute if it doesn't already exist, and set it to one of the following:
- off - No debug window. Setting debug to this or to errors is required before putting your widget into the Widget Gallery.
- errors - Only turn on the debug window when errors are encountered (Note that this refers to JavaScript errors, which may or may not be raised by problems with your widget!).
- on - The debug window is always on.
- verbose - The debug window is always on, and extra information about the execution of your widget is displayed (such as timers firing, event handlers being raised, etc.).
Here is an example of what the top of your .KON file should look like:
<?xml version="1.0" encoding="UTF-8"?>
<?konfabulator xml-strict="true"?>

<widget debug="errors">
  ...
</widget>
Interactive Debugging[]
As of version 2.1 of Konfabulator, the debug window is no longer a passive information display window - you can interact with it in a number of different ways.
The way in which you interact with the debug window is through the Evaluate bar. You can type arbitrary JavaScript code here which will be executed as though it were in your Widget code, or there are a number of built-in commands which provide additional information about your Widget environment.
Type /help in the Evaluate bar to see a full list of supported commands. Currently the available commands are:
| /dump object | print all the properties of 'object' |
| /trace function | print a message every time 'function' is called |
| /untrace function | stop tracing 'function' |
| /watch object.property | display a message when the given 'property' of 'object' changes |
| (arbitrary JavaScript) | execute the given JavaScript |
| /help | this list of commands |
The ability to execute aribrary JavaScript at runtime can be extremely useful - it allows you to very quickly test expressions, check the values of properties and variables and make temporary alterations to your Widget on the fly. For example, If you wanted to quickly see what your Widget would look like if you changed a particular Text object's scrolling property from 'left' to 'right', you can do this without the need to reload your Widget.
This Article demonstrates how to achieve the effect of the /dump command in JavaScript.